Announcing Our Upcoming Webinar: Unleashing IoT Potential with Voltmetrix and Software.com.br
Introduction
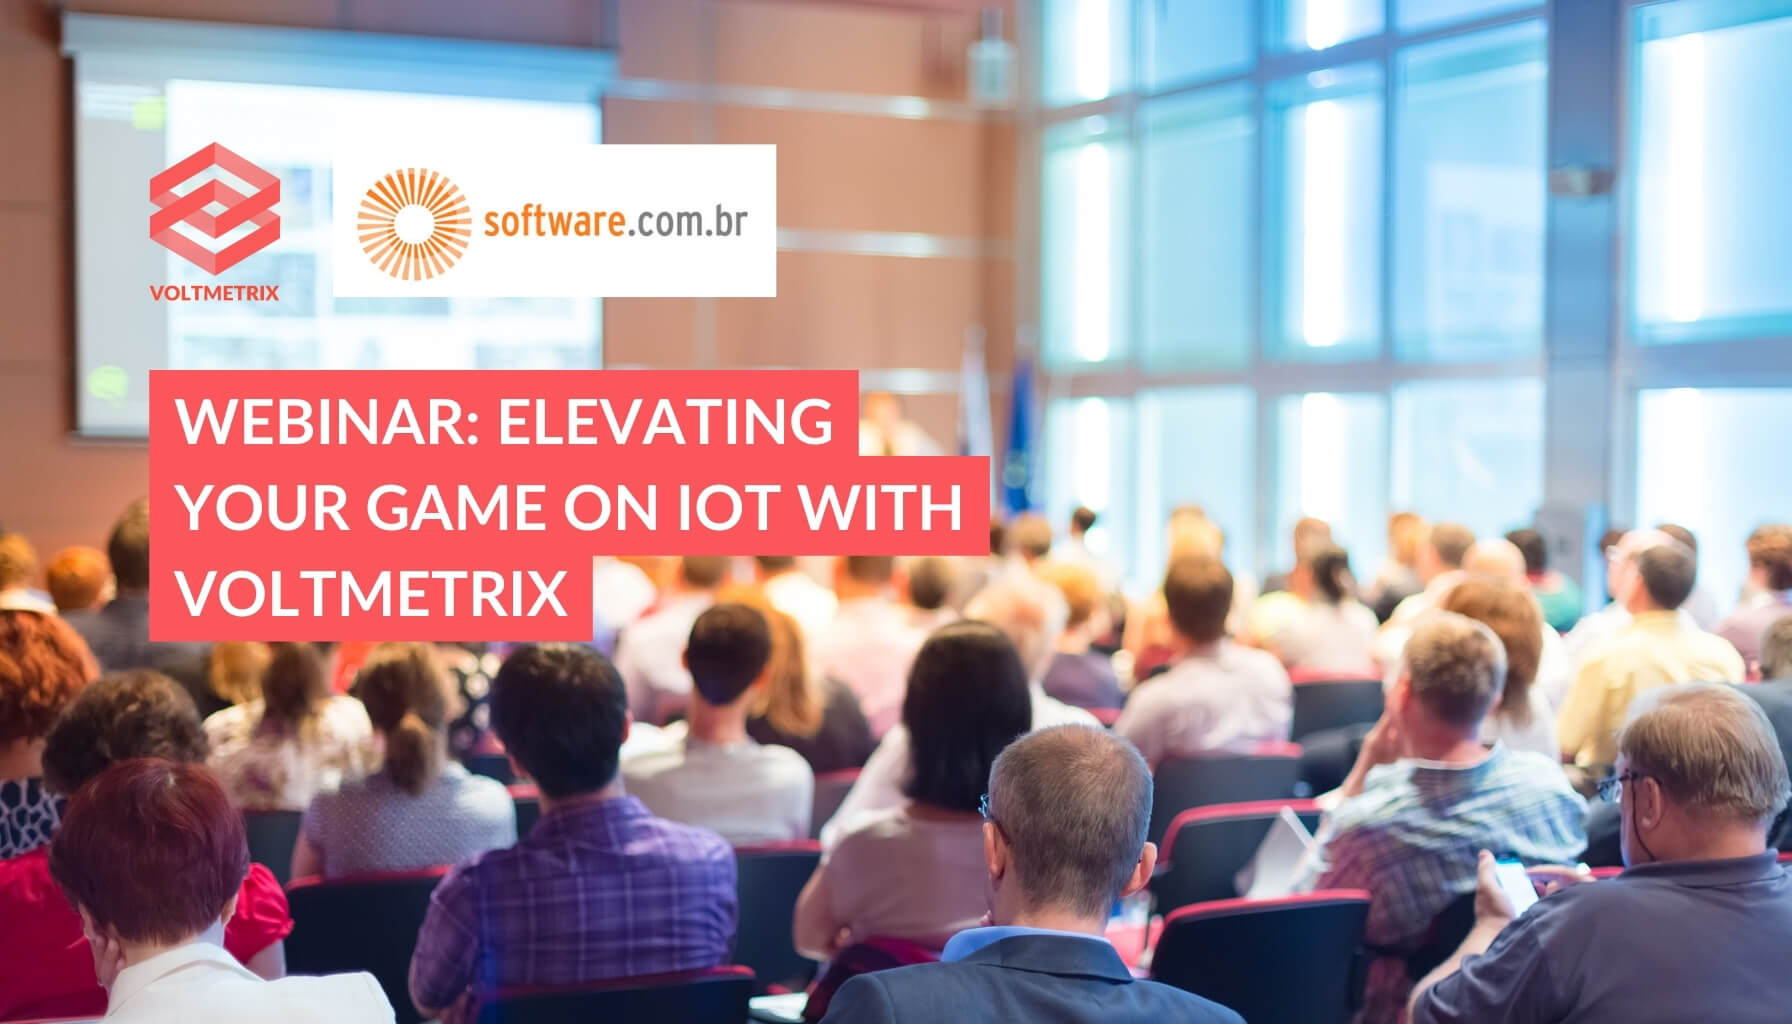
We are thrilled to announce a joint webinar scheduled for March 13th at 2 PM São Paulo time, brought to you by Voltmetrix in partnership with Software.com.br, a leader in technology solutions for the corporate world in Latin America.
About Software.com.br
Software.com.br has established itself as a benchmark in technology solutions in Latin America. With a team of specialized consultants, they are dedicated to delivering the most effective solutions to meet the diverse needs of the corporate world. "Somos a Software.com.br, referência em soluções de tecnologia para o mundo corporativo na América Latina. Conte com nossos consultores especializados." This commitment to excellence makes them an ideal partner for Voltmetrix.
Voltmetrix: Revolutionizing IoT Data Management
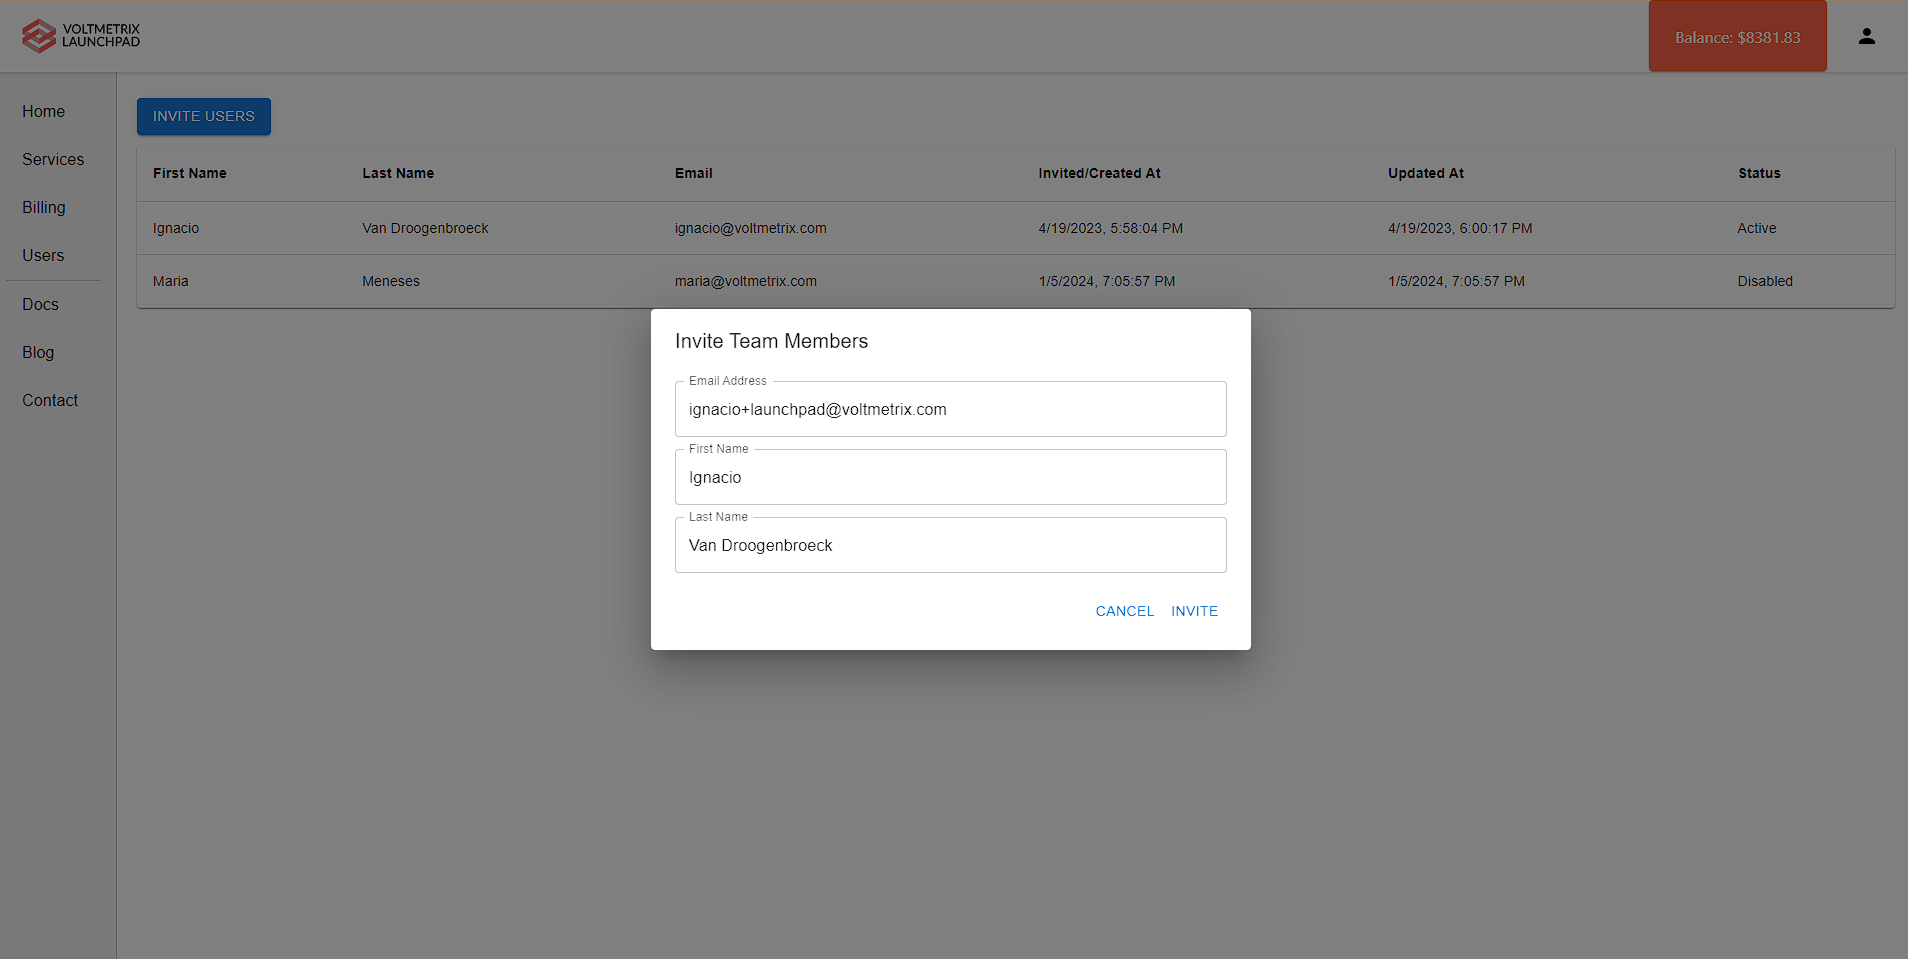
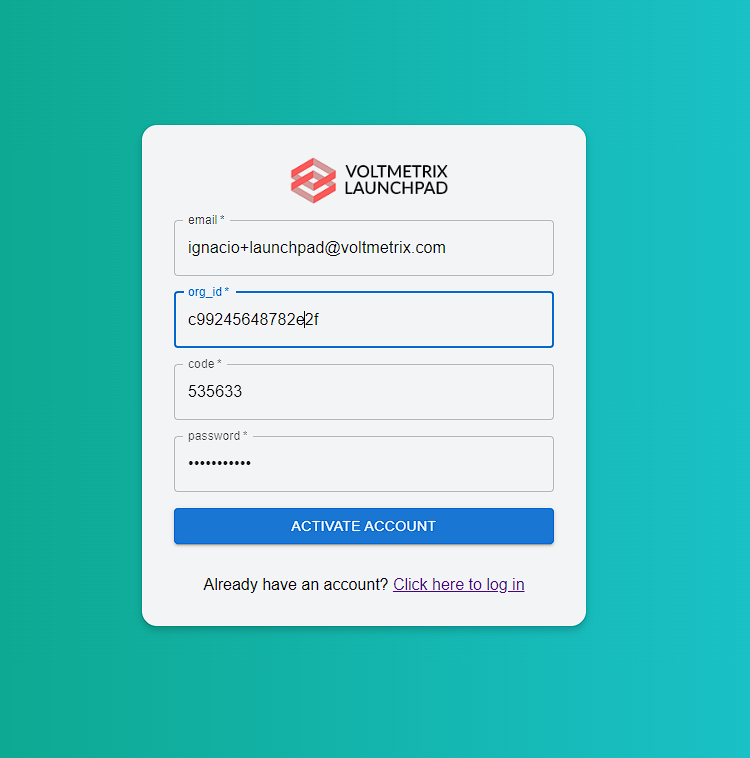
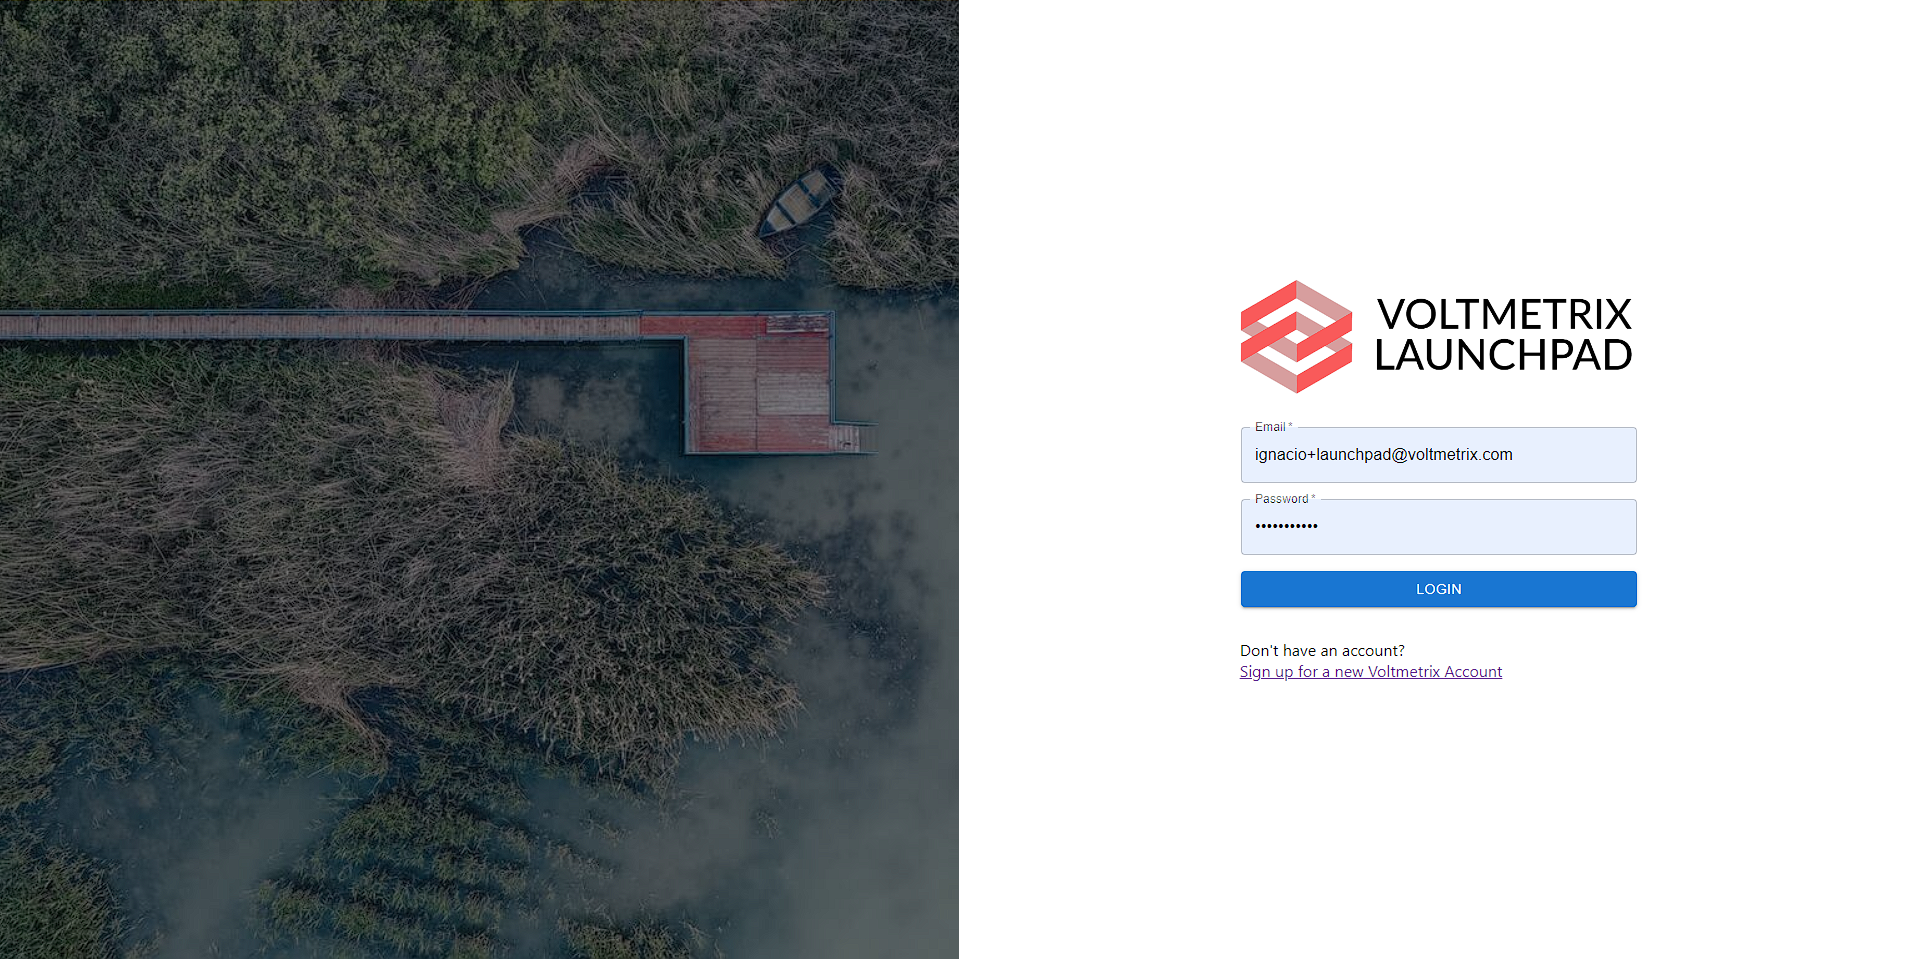
At Voltmetrix, we are focused on transforming how developers, engineers, and data scientists manage and utilize data in real time. Our next-generation hosted and managed data platform is tailored for IoT, Observability, and Analytics. By deploying data solutions like MySQL, ClickHouse, InfluxDB, and Grafana in minutes across multiple cloud platforms, we eliminate the hassle of maintaining infrastructure. Our commitment to security, global coverage, and round-the-clock monitoring ensures that your data solutions are not just efficient, but also secure and reliable.
Why This Webinar?
In this webinar, we will showcase real-world IoT use cases and discuss how the collaboration between Voltmetrix and Software.com.br can be a game-changer for your business. You'll discover:
- Innovative IoT Solutions: How IoT is reshaping industries and the role of data management in leveraging IoT's full potential.
- Synergy of Expertise: The combined strengths of Voltmetrix's data management capabilities and Software.com.br's technological solutions.
- Real-time Data Management: Explore how Voltmetrix enables real-time data analytics and visualization, crucial for IoT applications.
- Case Studies and Applications: Learn from practical examples and use cases where IoT has made a significant impact.
- Q&A Session: Your chance to ask questions and get insights directly from experts at Voltmetrix and Software.com.br.
Reserve Your Spot!
Don’t miss this opportunity to learn how Voltmetrix and Software.com.br can empower your business with cutting-edge IoT solutions. Mark your calendars for March 13th, at 2 PM São Paulo time, and join us for an insightful session. Click here to register for the webinar.

 Photo by
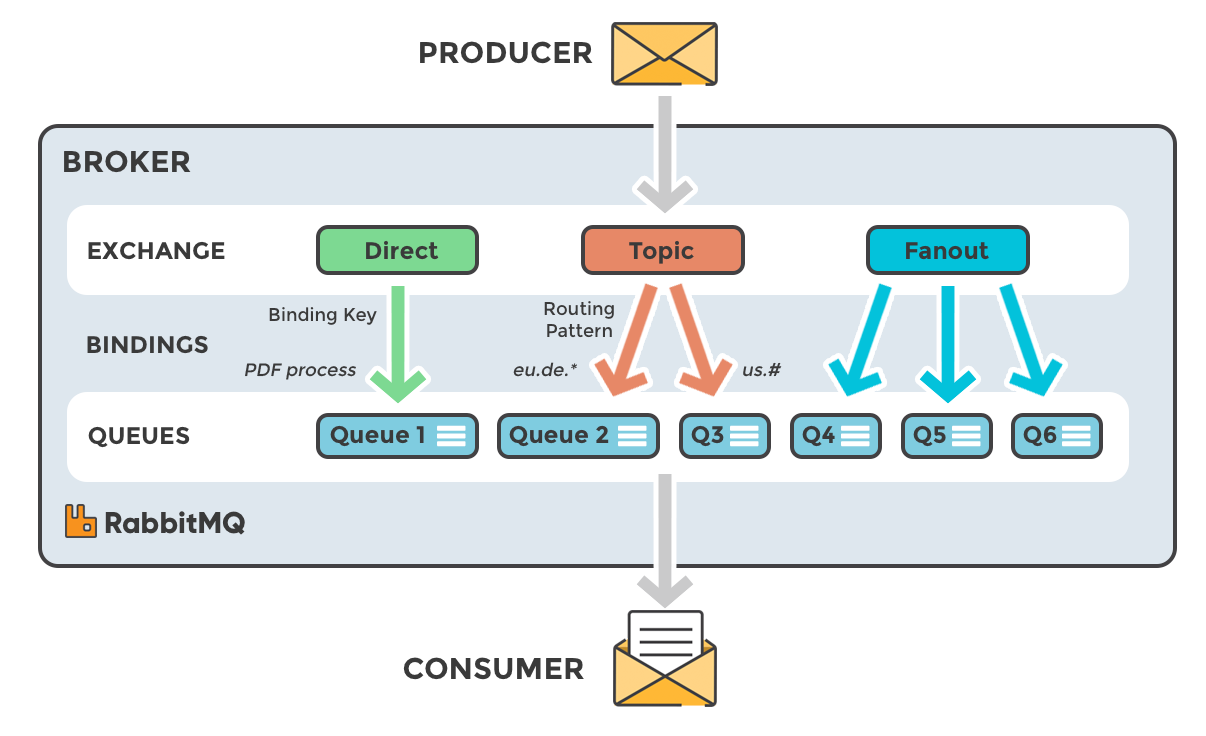
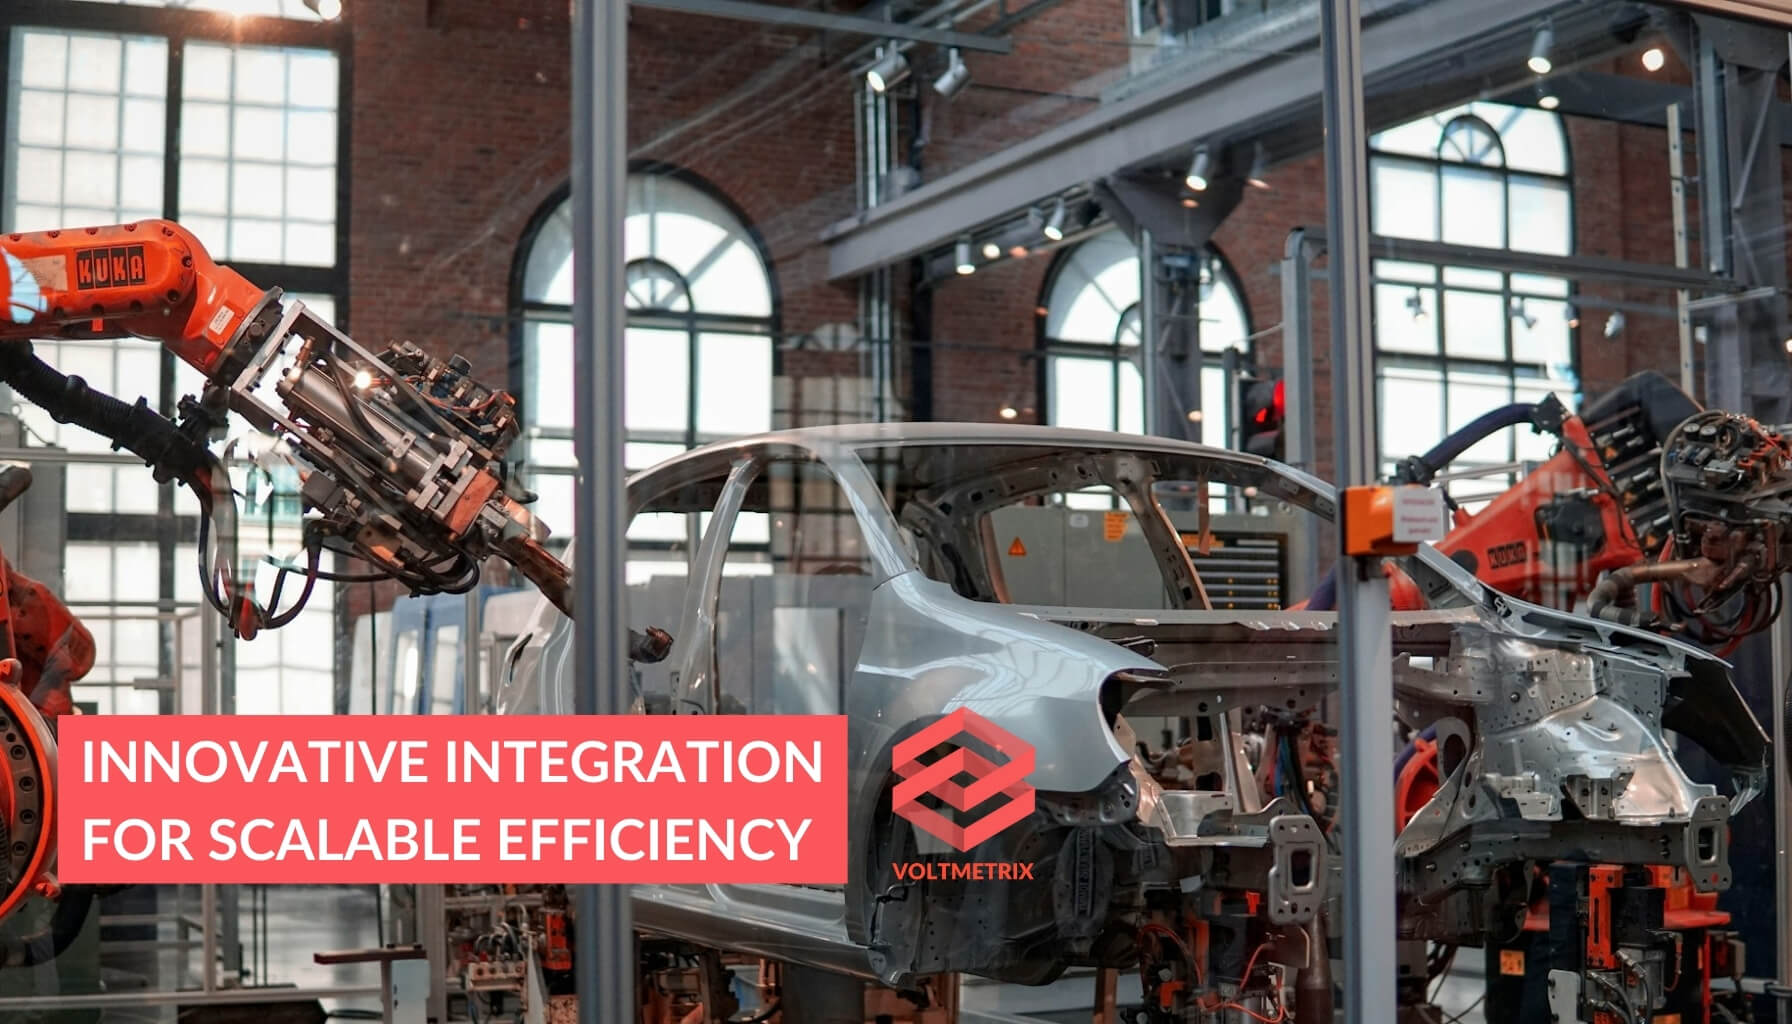 Photo by
  Photo by
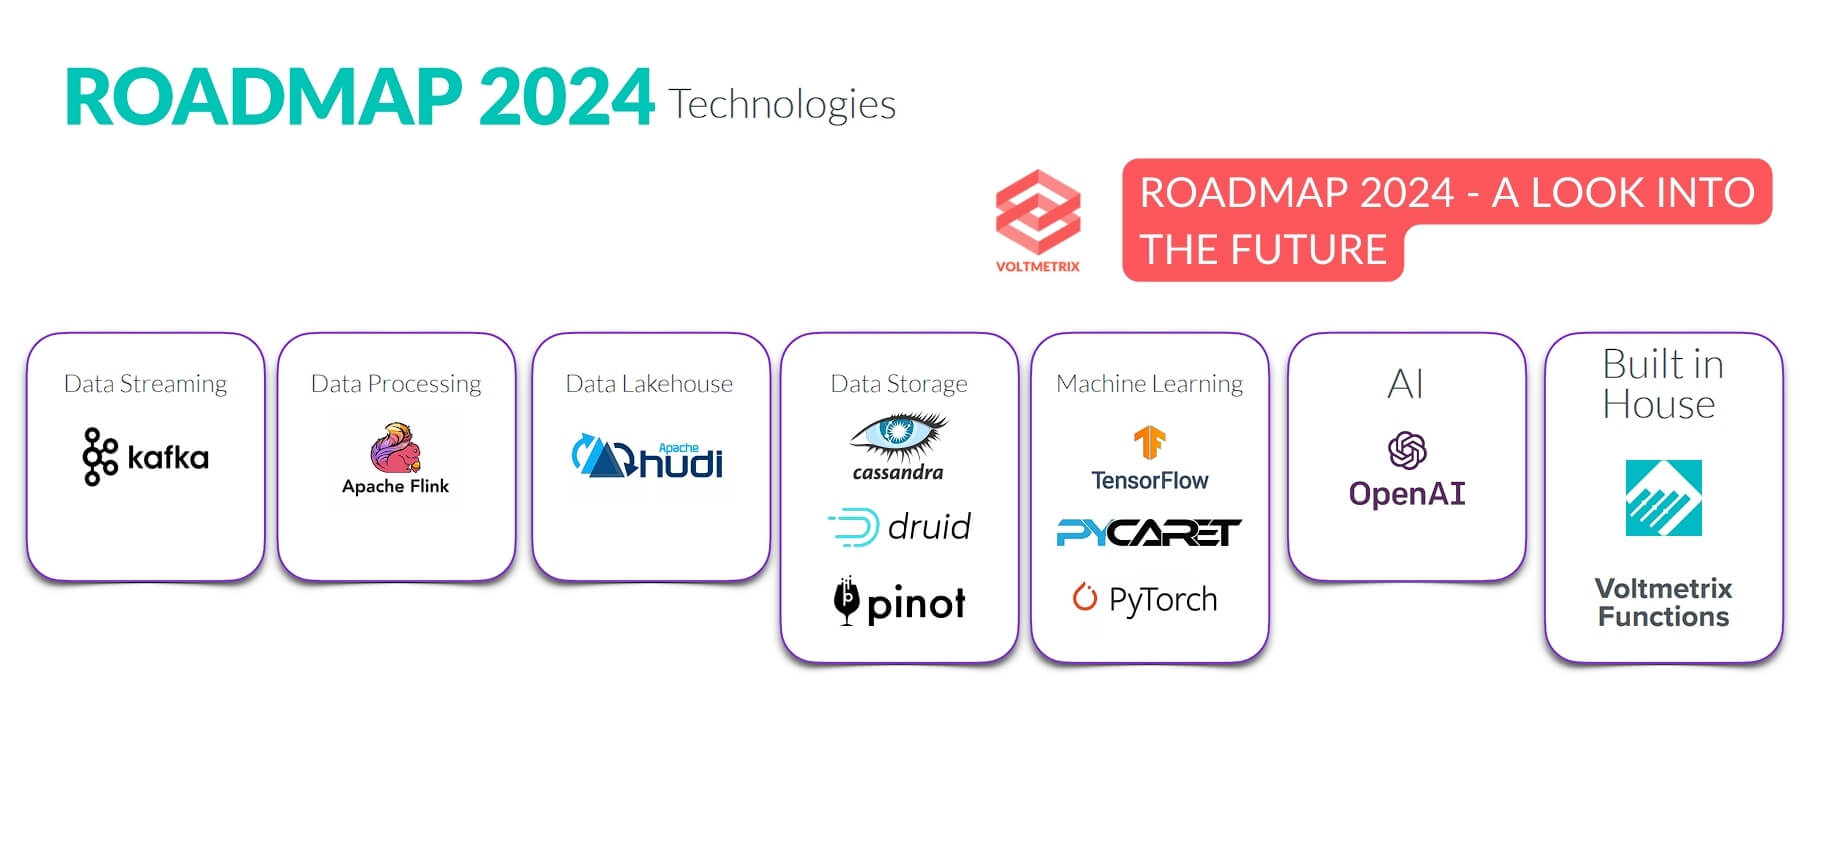

 Photo by