Photo by Osman Rana on Unsplash
Introduction:
I love data, and I find it very interesting to consume data from different sources that allow me to understand what's happening around me. Whether it's tracking flights and ships, as I showed you in this blog post Tracking ships with InfluxDB or weather data, as I will demonstrate in this blog post.
In this blog post, I will show you how to collect weather data using OpenWeatherMap, Python, and InfluxDB as a database.
Are you ready to dive into this storm? Let's go!
What is InfluxDB?
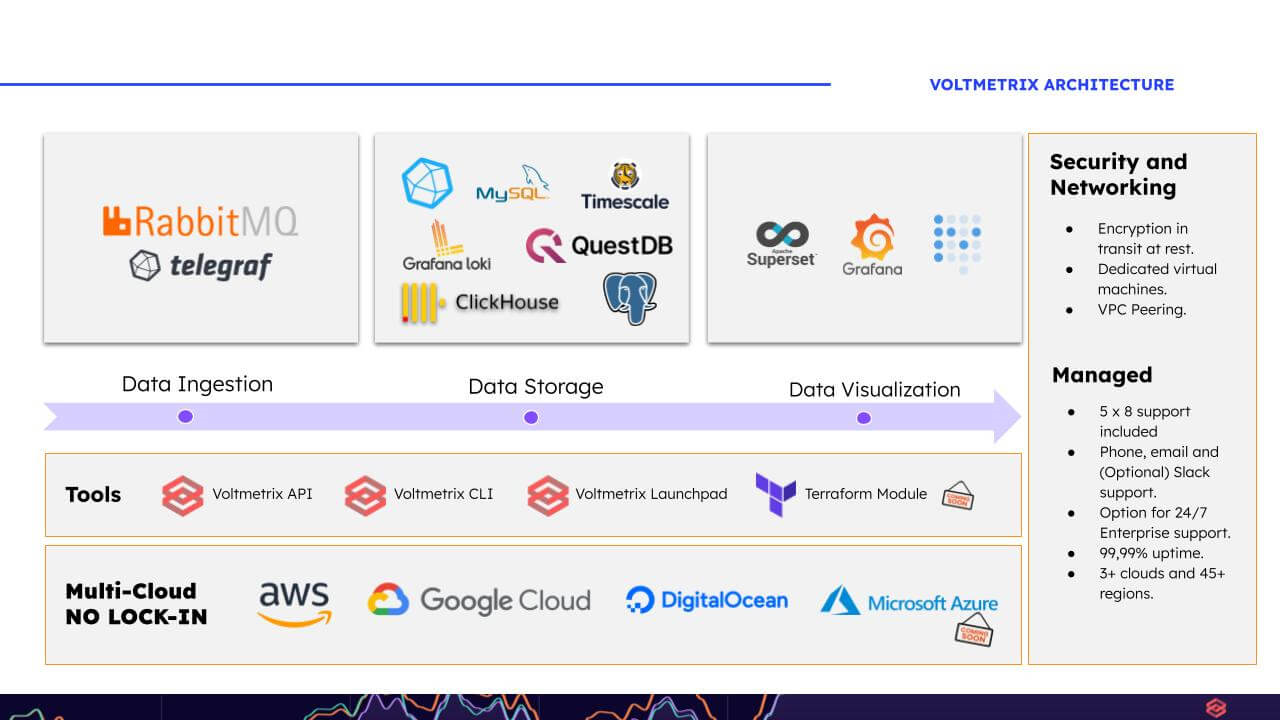
InfluxDB is a time-series database that allows you to store time-series data. It's a very powerful database that depends on the version you are using; you can manage it using InfluxQL or Flux. In this case, we are going to deploy InfluxDB v2.7 on the Voltmetrix platform.
Deploy InfluxDB
Deploying InfluxDB on the Voltmetrix platform is straightforward. You can have it up and running in a few minutes with SSL enabled and ready to use. As you know, there are three different ways to deploy InfluxDB on the Voltmetrix platform:
Using the Voltmetrix CLI
Using the Voltmetrix API
Using Voltmetrix Launchpad
For brevity, we will use the Voltmetrix CLI. The command for doing that is:
voltmetrix deploy \
--cloud gcp \
--database influxdbv2 \
--org_id your-org_id \
--token your-awesome-token \
--size e2-small \
--region us-east1
This command will deploy InfluxDB v2.7 on Google Cloud, in the us-east1 region, with an e2-small instance size. You can adjust the instance size according to your requirements. You can review the available sizes in the options. Voltmetrix CLI documentation.
Once we have that deployed and changed our password we can start to use it.
Create a bucket
The first thing that we need to do is create a bucket. A bucket is a container for time series data. You can create a bucket using the UI or using the CLI. In this case, we are going to use the CLI. The command for doing that is:
influx bucket create \
  --name weather \
  --org my-org \
  --retention 1y
If you prefer the UI, you can follow this steps.
Create a token
The next step is create a token. A token is a string that you can use to authenticate with the InfluxDB API. Is important to create an API token with the correct permissions to write data to the bucket that you created in the previous step. You can create a token using the UI or using the CLI. In this case, we are going to use the CLI. The command for doing that is:
influx auth create \
  --org my-org \
  --read-bucket 03a2bbf46309a000 \
  --read-bucket 3a87c03ace269000
Once you have that, you can start to write data to your bucket.
Collecting weather data
For collecting weather data we are going to use OpenWeatherMap. OpenWeatherMap is a service that allows you to get weather data from different cities around the world. You can check the documentation here.
You will need a token, you can get one for free from them.
The code
For this example, we are going to use Python. You can use any language that you want. The first thing that we need to do is install the library for interacting with OpenWeatherMap. You can do that using pip:
pip install pyowm
Also, we need to install the library for interacting with InfluxDB. You can do that using pip:
pip install influxdb-client
We will have two files: one for the code, which can be saved as "main.py," and the other for "values.py," where we will store the values for the InfluxDB connection and the OpenWeatherMap token. This step is not exclusive; you can use environment variables or any other method to manage these values.
The code is quite straightforward. We will retrieve weather data from Villa Rosa, Argentina, which is my hometown, and then write that data to InfluxDB. The data points will include temperature, humidity, weather condition, wind speed, wind direction, and atmospheric pressure. Additionally, we will record the latitude and longitude of the city.
from pyowm.owm import OWM
import influxdb_client
from influxdb_client import InfluxDBClient, Point
from influxdb_client.client.write_api import SYNCHRONOUS
from values import *

def temp():
    owm = OWM(api_key)
    get = owm.weather_manager()

    villa_rosa = get.weather_at_place('Villa Rosa,AR').weather
    temp_villa_rosa = villa_rosa.temperature(unit='celsius')['temp']
    hum_villa_rosa = villa_rosa.humidity
    condition_villa_rosa = villa_rosa.detailed_status
    wind_speed_villa_rosa = float(villa_rosa.wind()['speed'])
    wind_orientation_villa_rosa = villa_rosa.wind()['deg']
    pressure_villa_rosa = villa_rosa.pressure['press']

    client = InfluxDBClient(url, token, org)

    write_api = client.write_api(write_options=SYNCHRONOUS)

    data = [
        Point('weather').tag('location', 'Villa Rosa').field('temperature', temp_villa_rosa).field('humidity', hum_villa_rosa).field('condition', condition_villa_rosa).field('wind_speed', wind_speed_villa_rosa).field('wind_orientation', wind_orientation_villa_rosa).field('pressure', pressure_villa_rosa).field("lat", -34.4345459).field("lon", -58.889472),
    ]

    write_api.write(bucket, org, data)

temp()
The values.py config file looks like this:
# InfluxDB Cloud data https://cloud2.influxdata.com/signup

bucket = 'weather'
org = 'myorg'
token = '$YOUR_TOKEN'
url = "https://gcpb0cec328b.customers.voltmetrix.io:8086"

# Openmapweather data
api_key = '$YOUR_API_KEY'
Once everything is together, you can run the code using:
python3 main.py
If everything is ok, you will see something like this...
>>> Request: 'POST https://gcpb0cec328b.customers.voltmetrix.io:8086/api/v2/write?org=myorg&bucket=weather&precision=ns'
>>> Content-Encoding: identity
>>> Content-Type: text/plain
>>> Accept: application/json
>>> Authorization: ***
>>> User-Agent: influxdb-client-python/1.36.1
>>> Body: b'weather,location=Villa\\ Rosa condition="overcast clouds",humidity=66i,lat=-34.4345459,lon=-58.889472,pressure=1021i,temperature=11.15,wind_orientation=203i,wind_speed=1.85'
<<< Response: 204
<<< X-Influxdb-Build: OSS
<<< X-Influxdb-Version: v2.7.0
<<< Date: Tue, 12 Sep 2023 12:12:27 GMT
<<< Body:
Querying the data
Let's verify if the data is present. To do that, we will utilize the UI. You can refer to the documentation for detailed instructions on how to perform this check. here.
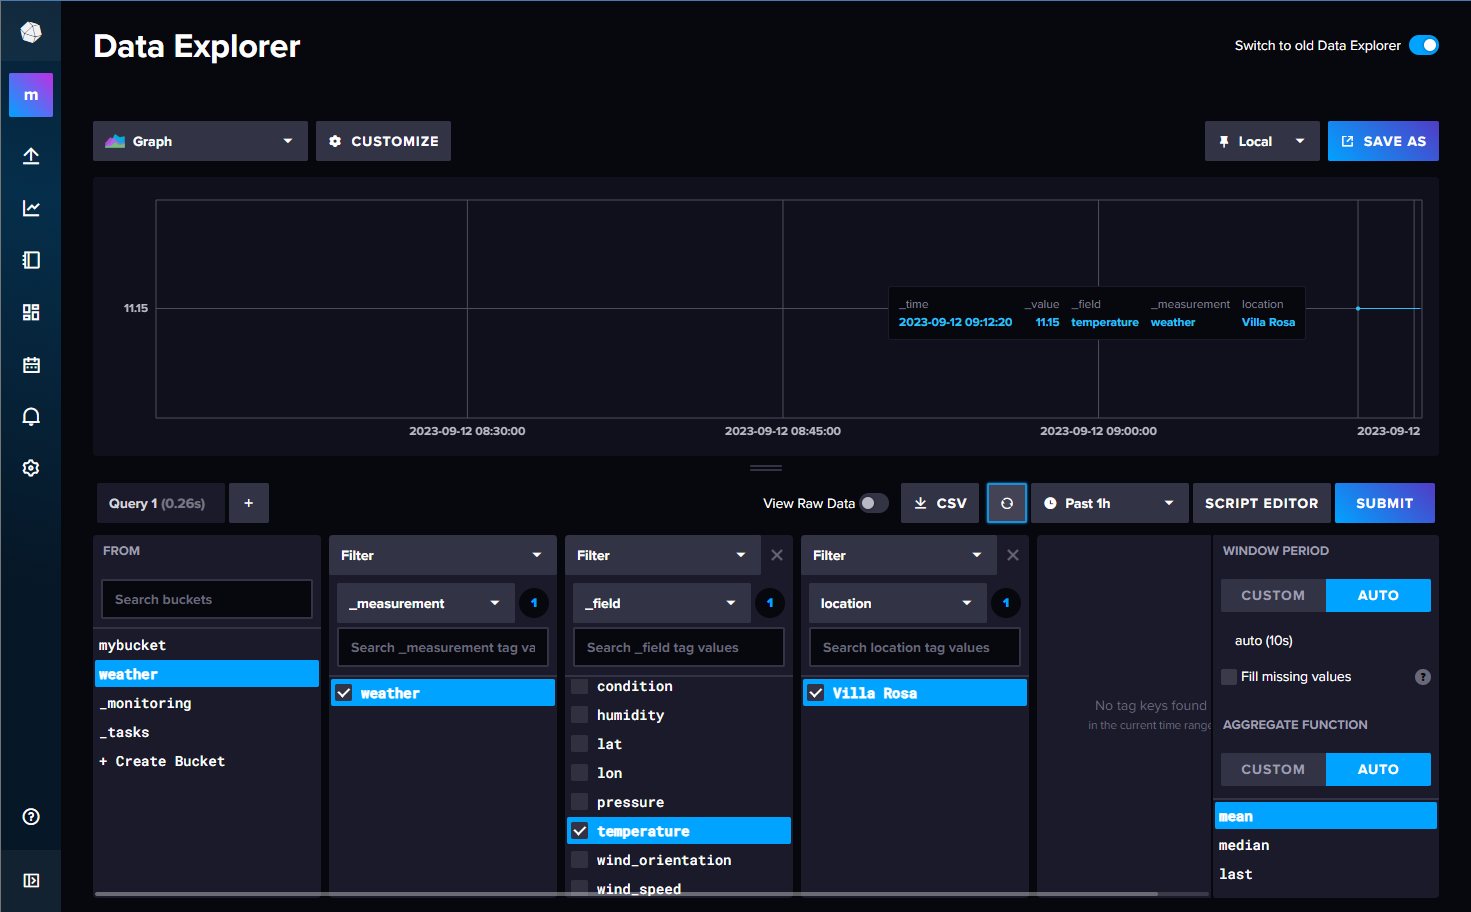
Indeed, 11.15 degrees is quite chilly at home! Time to bundle up and stay warm! 😄
Conclusion
In this blog post, we learned how to gather weather data using OpenWeatherMap and Python, utilizing InfluxDB as our database. Additionally, we explored the deployment process of InfluxDB on the Voltmetrix platform and how to write data to it.
As demonstrated, deploying your preferred database is a straightforward process, allowing you to begin collecting data from various sources in just a matter of minutes. I trust you found this blog post enjoyable and informative. I'd like to extend an invitation for you to sign up for Voltmetrix, where you can easily deploy the tools of your choice and start collecting data in a managed and hosted environment.


 Photo by

 Photo by
  Photo by