How to monitor your servers with Voltmetrix

Photo by Stephen Dawson on Unsplash
Introduction
In this article we will show you how to monitor your servers with Voltmetrix, we going to use InfluxDB as our time series database and visualizatin tool too. As you know, you can deploy InfluxDB and Grafana from the Voltmetrix CLI without friction and in a few minutes.
Let's get started
Deploy InfluxDB
First, we need to deploy InfluxDB, we can do this with the following command:
voltmetrix deploy \
--cloud aws \
--database influxdbv2 \
--org_id your-org_id \
--token your-awesome-token \
--size t2.small \
--region us-east-1
Once the deployment is complete, we highly recommend you to change the default password, for that, first you need to download and install it following the instructions in the InfluxDB CLI documentation.
you can do this with the following command (Example, you server url is different, please use your server url):
influx user password -n admin -p your-new-password -h 5c9f5b5c.customers.voltmetrix.io:8086 -t your-token
The token needs to be created from the web console of InfluxDBv2. You can find the instructions here.
With your new password, lets login to the InfluxDB Web Console and create a new bucket, for that, click on the Data menu and then click on Buckets, then click on Create Bucket button, fill the form with the following information:
- Bucket Name:
server_monitoring - Retention Period:
30 daysor specify the retention period that you want
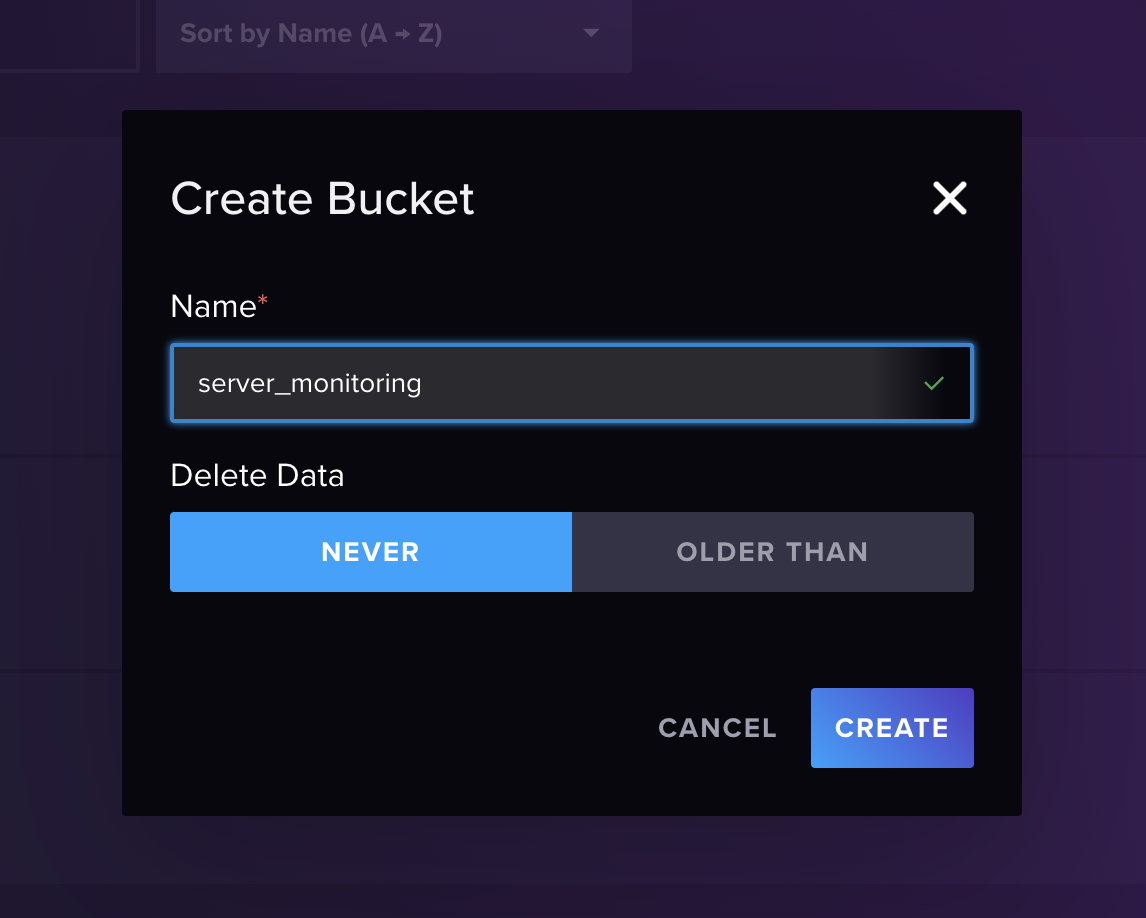
Click on Create Bucket button and you are done.
Let's create a new token to access the bucket, for that, click on the Data menu and then click on Tokens, then click on Generate Api Token button, choose custom and fill the form with the following information:
- Description:
server_monitoring - Permissions:
Read/Write - Bucket:
server_monitoring
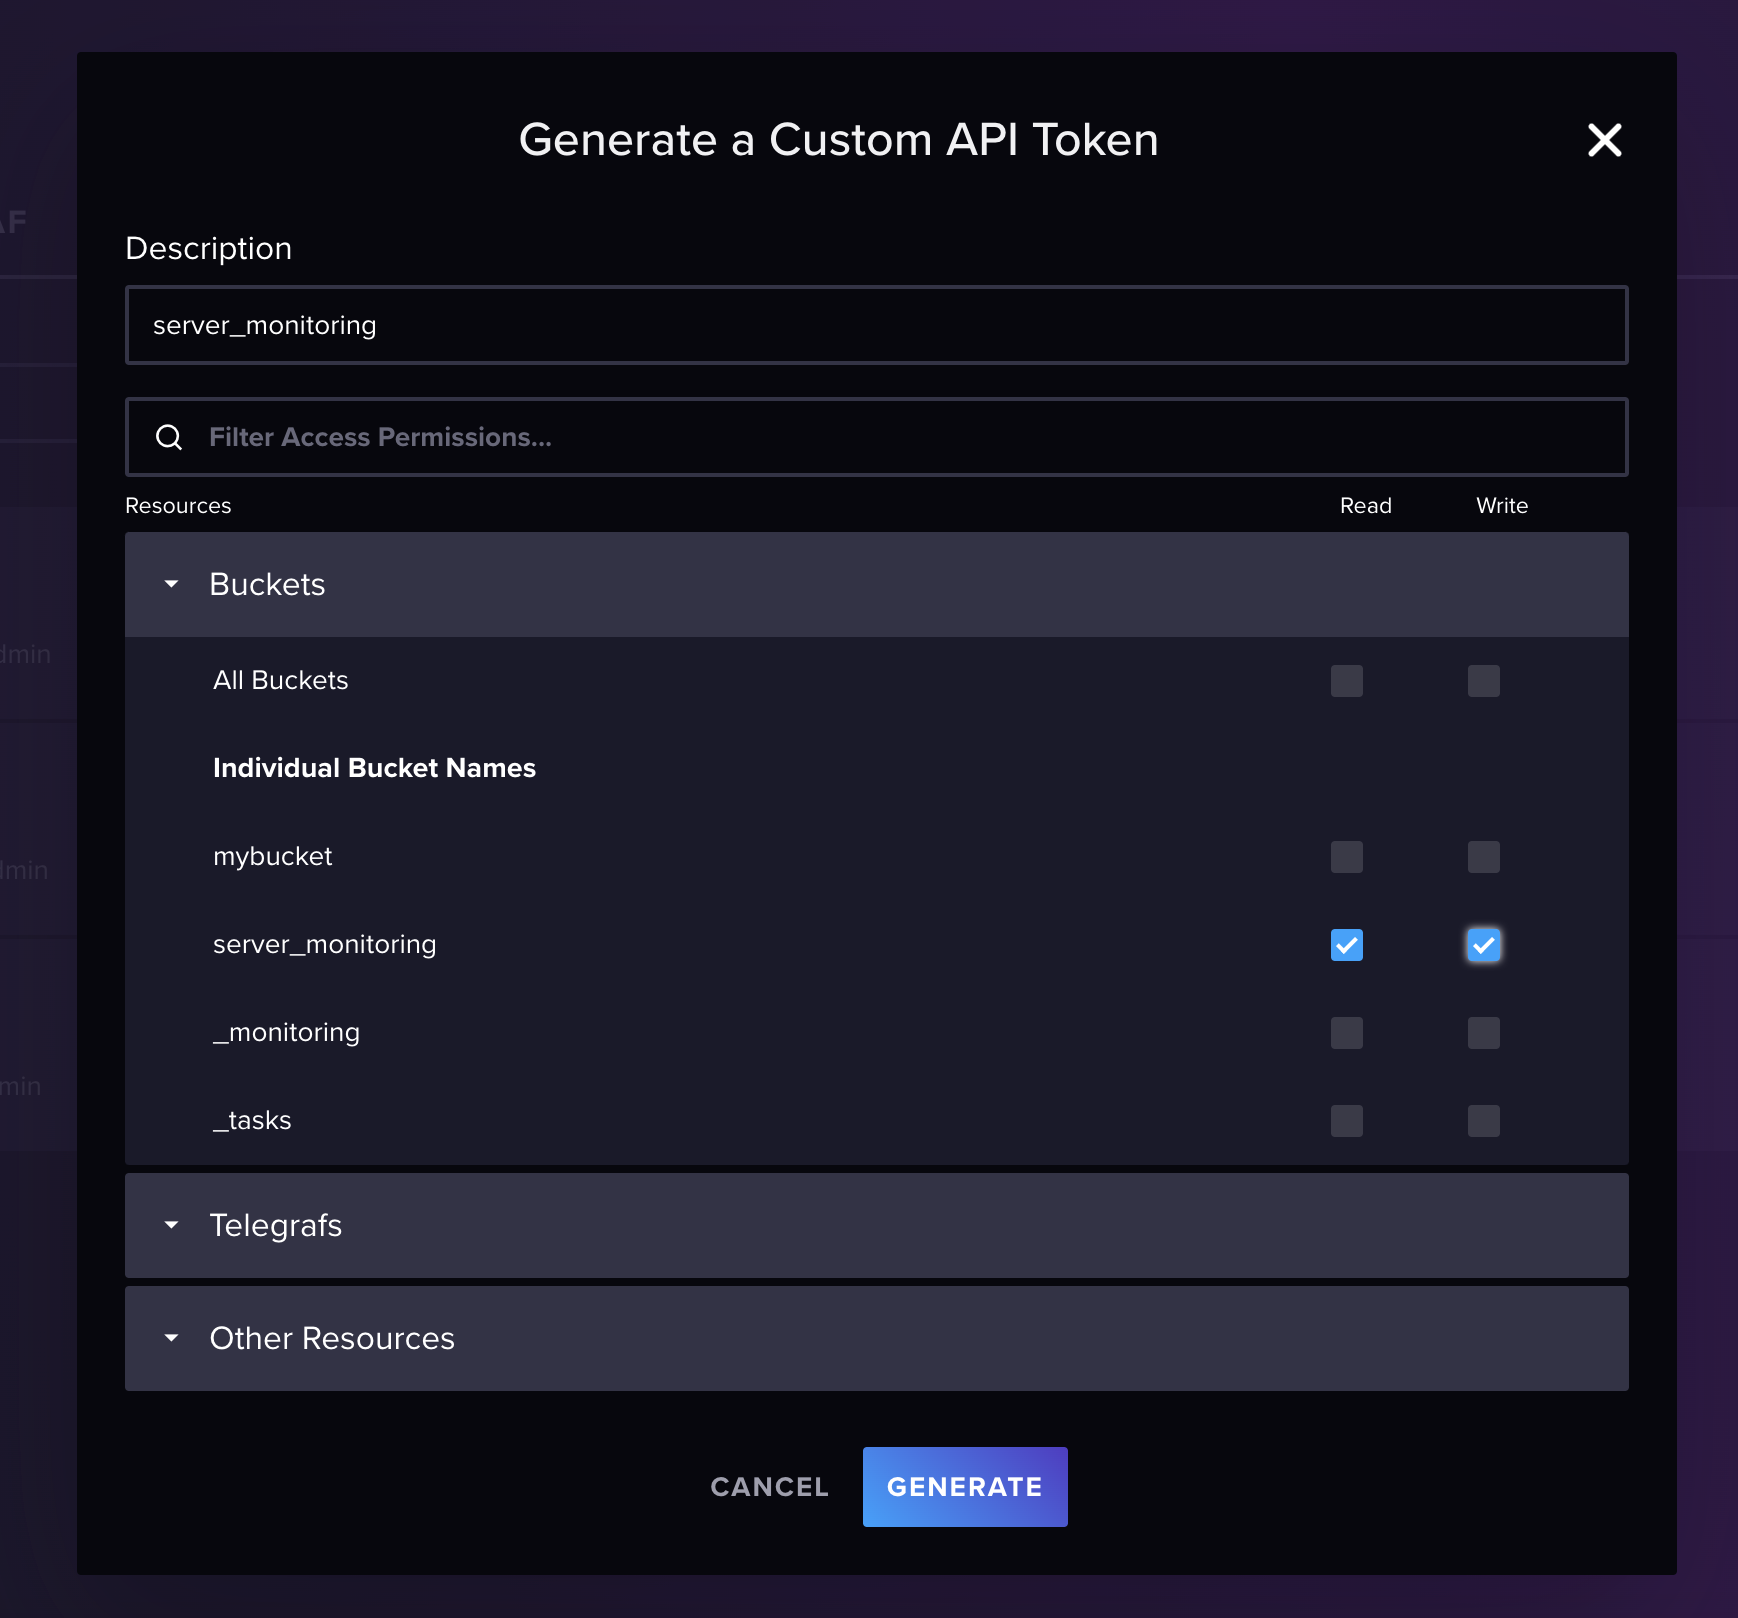
Click on Save button and you are done.
Start collecting data
To start collecting data, we need to install the Telegraf agent on the servers that we want to monitor, for that, you can follow the instructions in the Telegraf documentation.
Once is installed, we going to use this telegraf.conf file to start to collect CPU and Memory metrics. You can collect more data using plugins.
# Global tags can be specified here in key="value" format.
[global_tags]
  # dc = "us-east-1" # will tag all metrics with dc=us-east-1
  # rack = "1a"
  ## Environment variables can be used as tags, and throughout the config file
  # user = "$USER"

# Configuration for telegraf agent
[agent]
  ## Default data collection interval for all inputs
  interval = "10s"
  ## Rounds collection interval to 'interval'
  ## ie, if interval="10s" then always collect on :00, :10, :20, etc.
  round_interval = true

  ## Telegraf will send metrics to outputs in batches of at most
  ## metric_batch_size metrics.
  ## This controls the size of writes that Telegraf sends to output plugins.
  metric_batch_size = 1000

  ## Maximum number of unwritten metrics per output.  Increasing this value
  ## allows for longer periods of output downtime without dropping metrics at the
  ## cost of higher maximum memory usage.
  metric_buffer_limit = 10000

  ## Collection jitter is used to jitter the collection by a random amount.
  ## Each plugin will sleep for a random time within jitter before collecting.
  ## This can be used to avoid many plugins querying things like sysfs at the
  ## same time, which can have a measurable effect on the system.
  collection_jitter = "0s"

  ## Collection offset is used to shift the collection by the given amount.
  ## This can be be used to avoid many plugins querying constraint devices
  ## at the same time by manually scheduling them in time.
  # collection_offset = "0s"

  ## Default flushing interval for all outputs. Maximum flush_interval will be
  ## flush_interval + flush_jitter
  flush_interval = "10s"
  ## Jitter the flush interval by a random amount. This is primarily to avoid
  ## large write spikes for users running a large number of telegraf instances.
  ## ie, a jitter of 5s and interval 10s means flushes will happen every 10-15s
  flush_jitter = "0s"

  ## Collected metrics are rounded to the precision specified. Precision is
  ## specified as an interval with an integer + unit (e.g. 0s, 10ms, 2us, 4s).
  ## Valid time units are "ns", "us" (or "µs"), "ms", "s".
  ##
  ## By default or when set to "0s", precision will be set to the same
  ## timestamp order as the collection interval, with the maximum being 1s:
  ##   ie, when interval = "10s", precision will be "1s"
  ##       when interval = "250ms", precision will be "1ms"
  ##
  ## Precision will NOT be used for service inputs. It is up to each individual
  ## service input to set the timestamp at the appropriate precision.
  precision = "0s"

  ## Log at debug level.
  # debug = false
  ## Log only error level messages.
  # quiet = false

  ## Log target controls the destination for logs and can be one of "file",
  ## "stderr" or, on Windows, "eventlog".  When set to "file", the output file
  ## is determined by the "logfile" setting.
  # logtarget = "file"

  ## Name of the file to be logged to when using the "file" logtarget.  If set to
  ## the empty string then logs are written to stderr.
  # logfile = ""

  ## The logfile will be rotated after the time interval specified.  When set
  ## to 0 no time based rotation is performed.  Logs are rotated only when
  ## written to, if there is no log activity rotation may be delayed.
  # logfile_rotation_interval = "0h"

  ## The logfile will be rotated when it becomes larger than the specified
  ## size.  When set to 0 no size based rotation is performed.
  # logfile_rotation_max_size = "0MB"

  ## Maximum number of rotated archives to keep, any older logs are deleted.
  ## If set to -1, no archives are removed.
  # logfile_rotation_max_archives = 5

  ## Pick a timezone to use when logging or type 'local' for local time.
  ## Example: America/Chicago
  # log_with_timezone = ""

  ## Override default hostname, if empty use os.Hostname()
  hostname = ""
  ## If set to true, do no set the "host" tag in the telegraf agent.
  omit_hostname = false

  ## Method of translating SNMP objects. Can be "netsnmp" which
  ## translates by calling external programs snmptranslate and snmptable,
  ## or "gosmi" which translates using the built-in gosmi library.
  # snmp_translator = "netsnmp"

###############################################################################
#                            OUTPUT PLUGINS                                   #
###############################################################################

# Configuration for sending metrics to InfluxDB 2.0
[[outputs.influxdb_v2]]
  ## The URLs of the InfluxDB cluster nodes.
  ##
  ## Multiple URLs can be specified for a single cluster, only ONE of the
  ## urls will be written to each interval.
  ##   ex: urls = ["https://us-west-2-1.aws.cloud2.influxdata.com"]
  urls = ["https://5c9f5b5c.customers.voltmetrix.io:8086"]

  ## Token for authentication.
  token = "your-influxdbv2-token"

  ## Organization is the name of the organization you wish to write to.
  organization = "my-org"

  ## Destination bucket to write into.
  bucket = "server_monitoring"

  ## The value of this tag will be used to determine the bucket.  If this
  ## tag is not set the 'bucket' option is used as the default.
  # bucket_tag = ""

  ## If true, the bucket tag will not be added to the metric.
  # exclude_bucket_tag = false

  ## Timeout for HTTP messages.
  # timeout = "5s"

  ## Additional HTTP headers
  # http_headers = {"X-Special-Header" = "Special-Value"}

  ## HTTP Proxy override, if unset values the standard proxy environment
  ## variables are consulted to determine which proxy, if any, should be used.
  # http_proxy = "http://corporate.proxy:3128"

  ## HTTP User-Agent
  # user_agent = "telegraf"

  ## Content-Encoding for write request body, can be set to "gzip" to
  ## compress body or "identity" to apply no encoding.
  # content_encoding = "gzip"

  ## Enable or disable uint support for writing uints influxdb 2.0.
  # influx_uint_support = false

  ## Optional TLS Config for use on HTTP connections.
  # tls_ca = "/etc/telegraf/ca.pem"
  # tls_cert = "/etc/telegraf/cert.pem"
  # tls_key = "/etc/telegraf/key.pem"
  ## Use TLS but skip chain & host verification
  # insecure_skip_verify = false

###############################################################################
#                            INPUT PLUGINS                                    #
###############################################################################


# Read metrics about cpu usage
[[inputs.cpu]]
  ## Whether to report per-cpu stats or not
  percpu = true
  ## Whether to report total system cpu stats or not
  totalcpu = true
  ## If true, collect raw CPU time metrics
  collect_cpu_time = false
  ## If true, compute and report the sum of all non-idle CPU states
  report_active = false
  ## If true and the info is available then add core_id and physical_id tags
  core_tags = false


# Read metrics about memory usage
[[inputs.mem]]
  # no configuration verificationa
  # insecure_skip_verify = false
fill with your details and save this as telegraf.conf file and run the following command to start the telegraf service:
sudo systemctl start telegraf
If you want to run mannually the telegraf service you can run the following command:
telegraf --config telegraf.conf
If everything is ok, you should start to see the metrics in your InfluxDB 2.0 bucket.
Visualize the metrics in InfluxDBv2
Now that we have the metrics in InfluxDBv2, we can visualize them in the built-in visualization tool that come with InfluxDB. To do that, go to explore and select the bucket where you are storing the metrics. In my case, I am using the server_monitoring bucket.
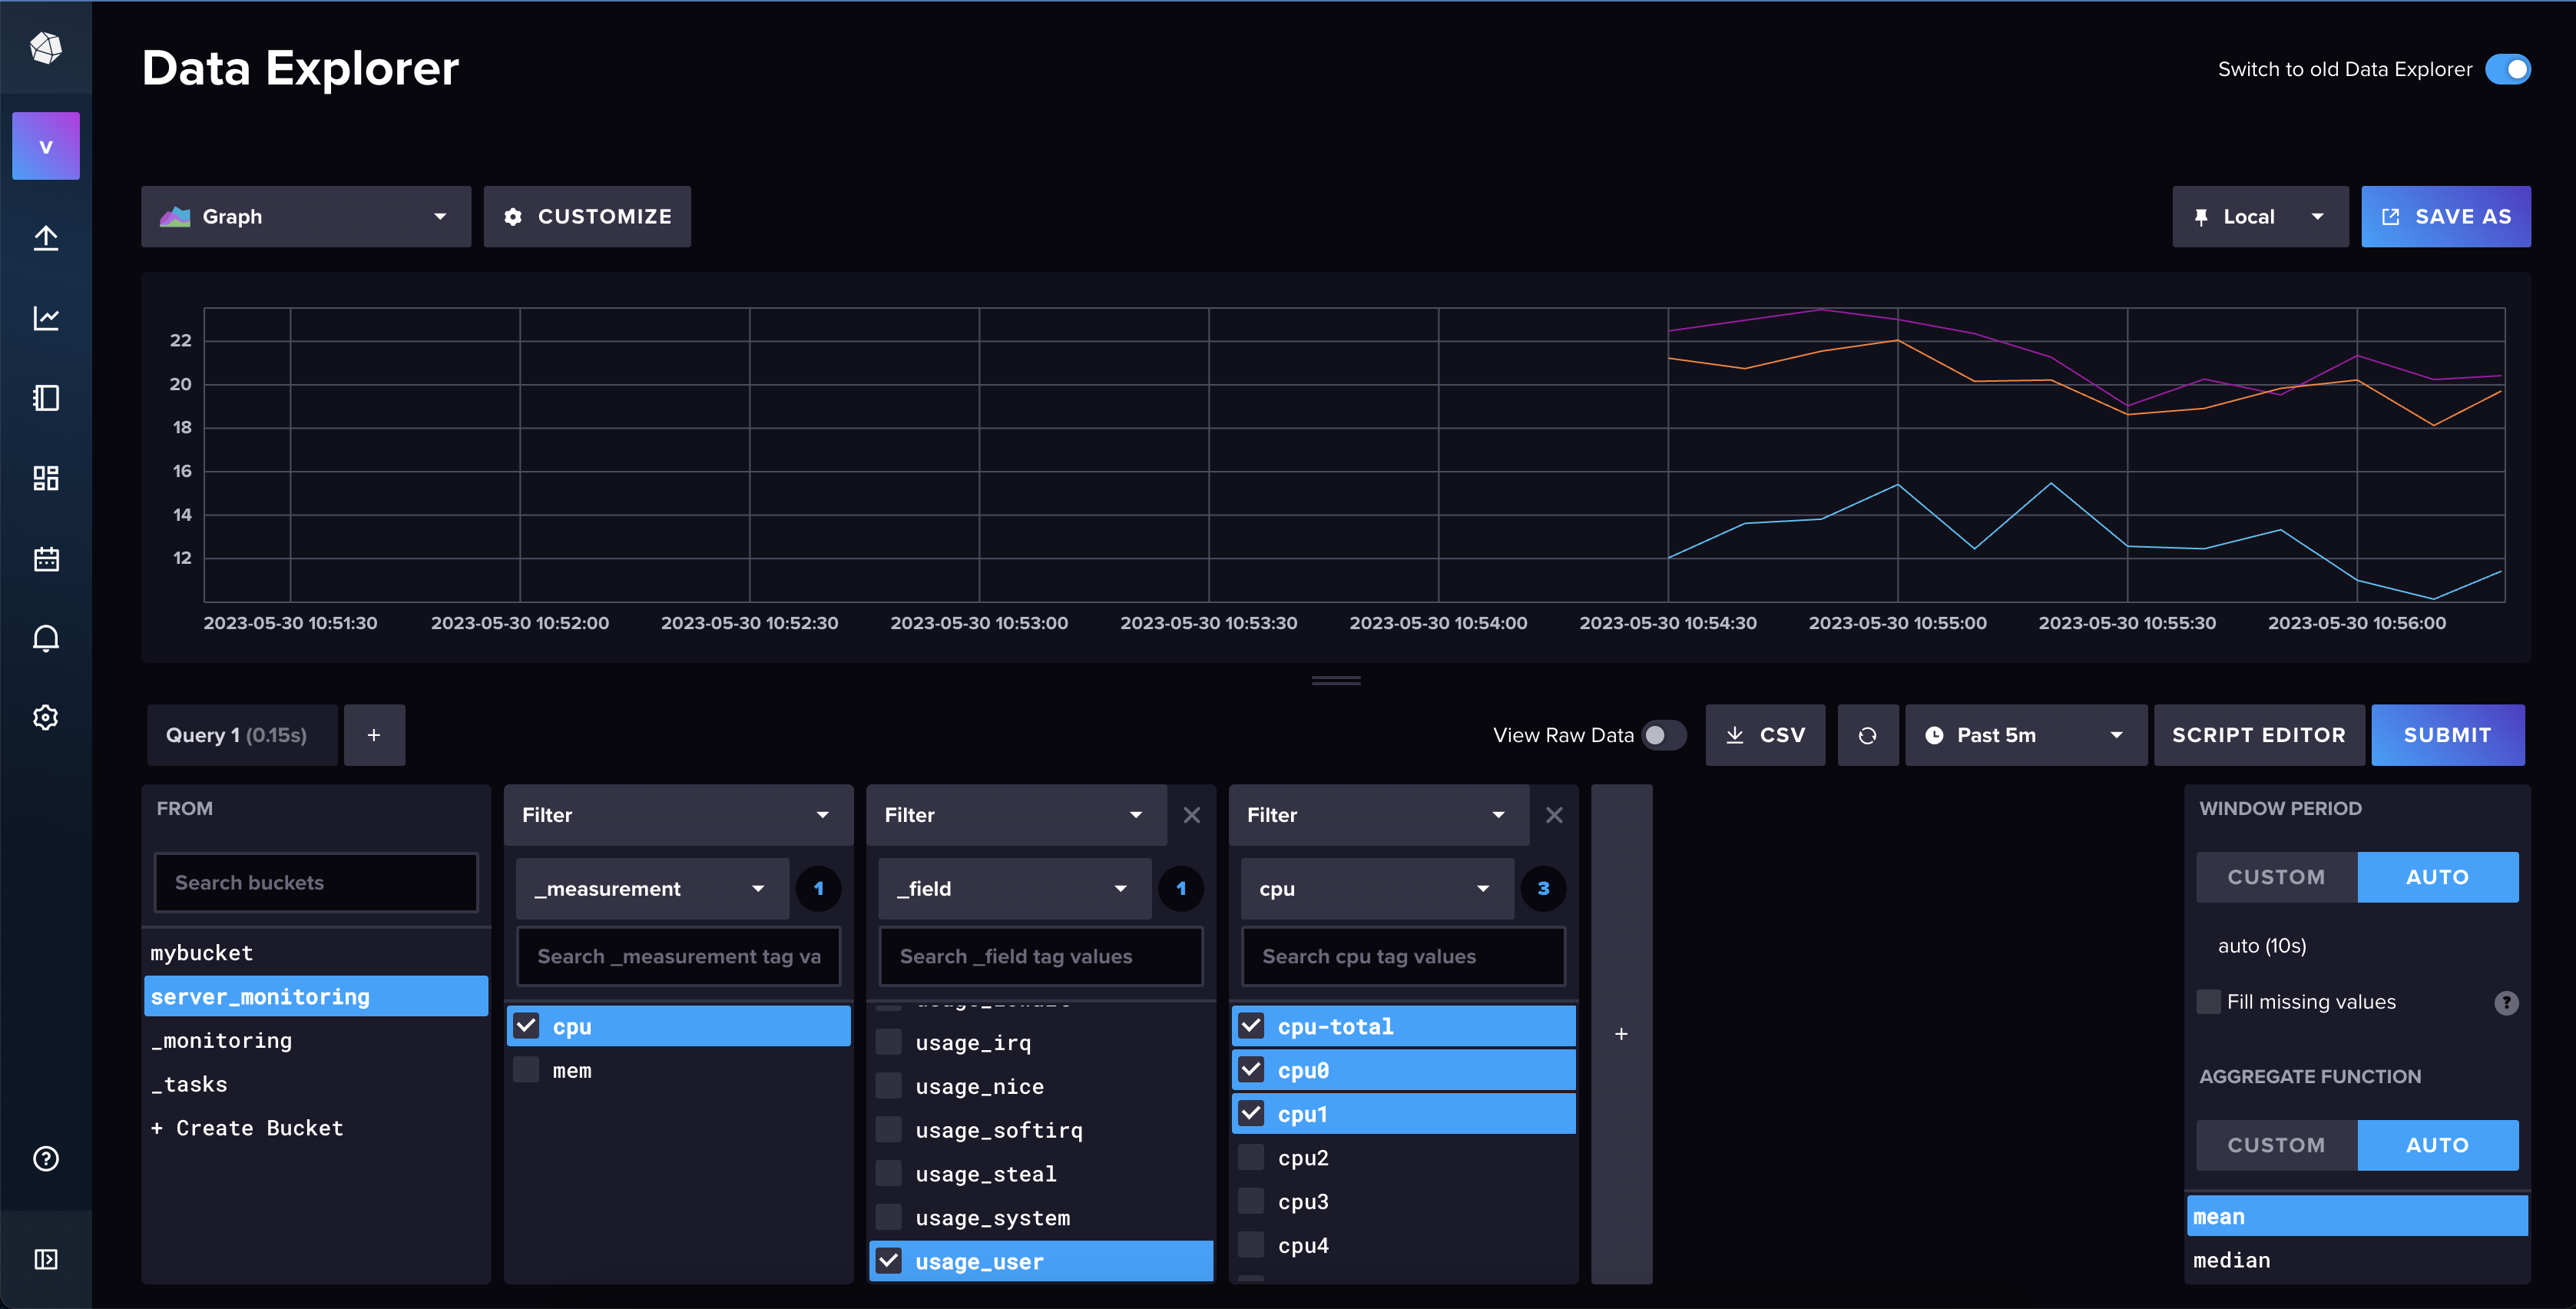
We recommend you switch to old data explorer, as the new one is still has some bugs.

Now you can start to create your own dashboards. To do that, click on the "Dashboards" button and then click on "Create Dashboard" and let your imagination fly.
Conclusion
In this tutorial, we have seen how to install and configure Telegraf to collect metrics from your server and send them to InfluxDBv2. We have also seen how to visualize the metrics in InfluxDBv2 too. If you have any questions, please feel free to contact us at Voltmetrix.